


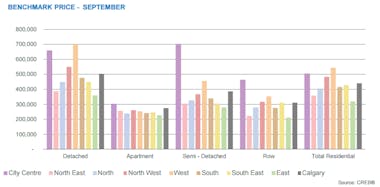
The segment of Calgary’s housing market with the greatest influence on the overall market is showing signs of pricing stability. The detached benchmark price totaled $503,400 in September, which is 3.3 per cent below last year, but the second consecutive month at this price level.
While overall economic conditions remain soft, for now the detached sector is demonstrating some steadiness in terms of pricing.
“The decline in demand has caused many to anticipate steeper price declines for detached homes,” said CREB® chief economist Ann-Marie Lurie. “That hasn’t happened in large part because detached supply levels haven’t climbed as sharply as many expected. There was a limited amount of supply in the overall market when this cycle began, and while levels did rise and remain somewhat elevated, they were well below previous highs.”
The level of detached new listings also eased compared to last year, helping push down year-over-year inventory levels for the second consecutive month.
“Consumers are really starting to come to terms with the current environment,” said CREB® president Cliff Stevenson. “Most sellers have adjusted their expectations at the same time that many buyers are realizing the price of a home is influenced by factors like location, supply in specific price ranges and condition of the property.”
Residential inventory levels totaled 5,877 in September, five per cent higher than last year, due to gains in both the apartment and attached sectors. City-wide months of supply neared four months, but ranged from a low of three months in the detached sector to a high of eight months in the apartment sector.
Sales were equally inconsistent, improving by four percent in the detached market while declining by 23 percent in the apartment sector. Nonetheless, in every category, sales activity year-to-date sales activity has declined over levels recorded last year and remains below long-term averages.
The resale apartment market has recorded large inventory gains and a sharp pull-back in sales. This, combined with additional competition from new builds, is resulting in steeper price adjustments in this sector.
Condominium apartment prices totaled $274,700 in September, 0.1 per cent below last month and 6.8 per cent below last years’ price.
Click on the following link to see the Calgary Housing Stats: september-2016-monthly-housing-statistics
or Click on following link to see the Regional Housing Stats: september-2016-regional-monthly-stats-package
calgary house statistics update
Regional sales outpace long-term averages
Higher inventory levels push downward on price Sales activity in the resale residential housing market surrounding Calgary continued to outperform long-term averages in the third quarter despite reporting double-digit declines when compared with last year.
A total of 1,269 units exchanged hands from July to September, representing a 20 per cent drop from record-setting levels established during the same time in 2014. Overall, however, year-to-date activity in the surrounding area continued to outperform both the five- and 10-year averages.
New listings, meanwhile, declined year-over-year by a moderate three per cent to 2,229 units, contributing to inventory gains during the quarter. Months of supply in the region increased from 4.3 in July to 5.7 in September. While higher months of supply are typical for the surrounding area, easing absorption rates started to place downward pressure on quarterly benchmark prices, declining by 0.41 per cent to $433,033 compared to last quarter.
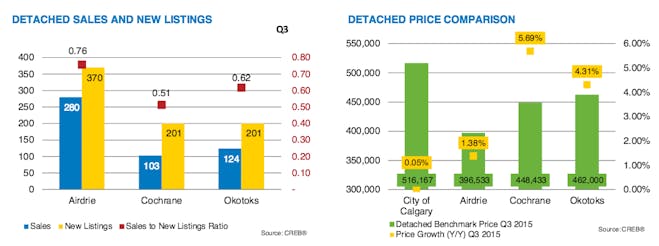
Robust listings in both Airdrie and Cochrane, specifically, caused notable inventory gains. Nonetheless, detached benchmark prices in both municipalities remained relatively stable, posting moderate changes from the previous quarter and remaining higher than levels recorded last year.
Click on the link to download the entire report: Town_and_Country_Stats_Third_Quarter
CALGARY REGIONAL HOUSING MARKET STATISTICS
Prices ease as expected
Inventories rise as sales activity softens further
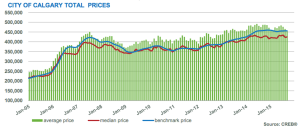
Following four months of relative stability, unadjusted benchmark prices eased as expected in September to $456,100, a 0.26 per cent decline compared with last year.
Most of this aggregate moderation was due to price declines in the apartment sector brought on by higher-than-average inventory levels.
“Overall sales activity relative to new listings caused a softening in absorption rates, which resulted in inventory gains and ultimately placed moderate downward pressure on pricing,” said CREB® chief economist Ann-Marie Lurie.
Residential sales in the city totaled 1,448 units in September, well below typical activity levels for this time of year. Year-to-date Calgary sales remained below both the five- and 10-year year averages by a respective 10 and 26 per cent.
“Rising unemployment and persistent weakness in the local economy is impacting housing demand,” said Lurie. “However, unlike earlier this year when consumers were reacting to uncertainty, recent activity reflects current economic conditions.”
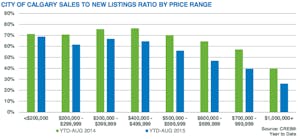
While all property types recorded a notable drop in the sales-to-new- listings ratio, both the apartment and attached segments saw the most significant declines. Ratios in both categories dropped to the 40 per cent range, while months of supply pushed up to 4.95 and 4.35, respectively.
In comparison, the detached category saw its ratio hover around 50 per cent in September and months of supply settle at 3.32.
Elevated inventory levels in the apartment segment, in particular, are the result of moderate listing declines relative to sales activity, noted Lurie. Year-to-date apartment sales have fell by 32 per cent, while listings have dropped by just seven per cent.
As a result, the apartment benchmark price totaled $290,600 in September, a 1.19 per cent decline over last month and 2.71 per cent below last year.
CREB® president Corinne Lyall said that while the apartment sector now favours buyers with added selection and attractive pricing, other factors will continue to play into purchase decisions.
“While the apartment sector offers more choice, not all units are created equal,” she said. “When considering apartment condominiums, it’s important to understand that the corporate and physical health of the building can also influence both buying and selling decisions in this type of market.”
Despite higher months of supply, typical home prices in both the detached and attached sectors remained relatively unchanged in September, totaling $517,200 and $357,000, respectively.
Although citywide inventory levels remained elevated compared to activity seen in the past three years, Lyall noted they still were well below highs recorded during the previous economic downturn in 2008/09.
“There is no question that we have seen a shift in our local housing market conditions, but it needs to be put in perspective,” she said.
Aggregate prices have eased by one per cent from the beginning of the year, a moderate correction when compared against the aggressive gains last year that averaged more than nine per cent, noted Lyall.
Click Here for the full .pdf of the CALGARY REGIONAL HOUSING MARKET STATISTICS
Check out our newsletter: YYC Newsletter Sept 2015
Spotlight on Luxury – RE/MAX Collection Report
Sales of homes priced over $1 million were up year-over-year in Toronto, Vancouver, Montreal and Victoria in the first seven months of the year. Calgary was the exception; sales in the $1 million range decreased 28 per cent over the same period in 2014.
In Canada’s two largest luxury markets, sales of homes $3 million and up saw impressive gains. In the Greater Toronto Area, sales in this range increased by 119 per cent and in Greater Vancouver by 79 per cent between January 1 and July 31.
The increase of sales at the top-end of the luxury market can be attributed to two factors. One is overall price appreciation in both markets, driven by low inventory and high demand for single-family homes that hasled to more homes meeting the higher dollar threshold. A second factor is high demand for luxury homes from foreign buyers in both markets.
In Calgary, a healthy 2.3 to 2.5 months’ supply of inventory in the $1 million plus range has brought a more balanced market to the city. Luxury buyers are not witnessing a notable decrease in price; however, there is less pressure for buyers during the negotiation process. With more inventory available, conditions like home inspection and financing, which were rarer when buyers were frequently in a competing offer situation, have become part of the normal negotiation process again.
RE/MAX brokers and agents reported that foreign buyers have continued to drive demand in the Vancouver and Toronto luxury markets in the first half of 2015. These buyers, primarily from China, are typically families with children who are relocating to Canada to live. They’ve chosen Canada for its stable economy and high quality of life, and their real estate decisions are strongly influenced by proximity to good schools.
Although foreign buyers are less active in Montreal’s luxury market compared to Toronto and Vancouver, RE/MAX brokers and agents have reported a substantial increase in foreign buyers in Montreal during the first seven months of 2015. Its relative affordability, aided by the strength of the yuan compared to the Canadian dollar during this period, make the city a
good value proposition for foreign buyers.
In regions where condominiums are a significant part of the luxury market, sales of condominiums priced over $1 million rose year-over-year. Montreal, Toronto and Vancouver all saw an increase of high-end condominium sales. While demand in the luxury freehold market was driven primarily by families, luxury condominium buyers tend to be Baby Boomers who are downsizing during retirement. These buyers tend to spend part of their time in a second home or travelling, and choose condominiums for access to luxury amenities without the maintenance required of a house.
Based on interviews with RE/MAX brokers and associates, luxury market trends seen in Canada’s major markets during the first seven months of the year are expected to continue through the end of 2015. Click Here or on the image below for the full report:

Calgary Regional Housing Market Statistics – August 2015
Inventory levels rise
August sales activity falls below long-term averages
Calgary’s residential resale housing market recorded further easing in absorption rates in August due to weaker sales activity.
Sales in the city declined by 27 per cent to 1,643 units last month relative to the same time last year, and 12 per cent below 10-year averages.
“Persistent weakness in the energy sector weighed on sales activity this month, which once again retracted to levels well below the norm for the city,” said CREB® chief economist Ann-Marie Lurie.
The residential unadjusted sales-to-new-listings ratio eased from 67 per cent in July to 60 per cent in August, contributing to a monthly rise in inventory levels to 5,146 units. Combined with weaker sales activity, months of supply pushed up to 3.13 months.
While every price range experienced fewer sales per new listing, homes in the higher price ranges saw the most significant decline in absorption rates compared to last year, noted Lurie.
Year-to-date new listings in the $600,000-plus category increased in share of activity compared to last year. However, sales activity in this price range represented 18 per cent of all the sales last month, down from nearly 20 per cent last year.
“With more options in the higher-end of the market, sellers will need to consider their competition as well as their goals regarding a sell date,” said CREB® president Corinne Lyall. “This will influence the pricing strategy they agree upon with their real estate professional.”
Lurie added that despite challenges near the top of the market, absorption rates in the under-$500,000 detached sector remained relatively tight and is likely causing some price trend discrepancies.
Despite weaker absorption rates, benchmark prices remained relatively stable, totaling $456,300 in August. Lurie credits this steadiness to both the detached and attached sectors, which have remained more balanced relative to the apartment sector.
The apartment sector continued to struggle with increased competition from competing properties during the month, as unadjusted months of supply rose to 4.3. Increased supply is ultimately weighed on pricing, as prices declined on a year-over-year basis by 1.44 per cent in August.
Overall, the combination of price declines and higher inventory levels in some segments of the market are influencing buying patterns in Calgary, said Lyall.
“Improved selection in these segments is giving buyers the opportunity to be discerning about their purchase decisions,” she said. “They may be weighing their options between resale and new product, along with what community fits their lifestyle.”
“Although market conditions affect consumers’ real estate decisions, so do their lifestyles. People move for a number of reasons, including proximity to work and schools, along with changes in family dynamics.”
Click Here for the Full August_2015_Monthly_Housing_Statistics
Calgary rental vacancies increase
The vacancy rate of rental properties in Calgary has increased due to greater supply of new homes.
Data from the latest census shows 12,526 vacant dwelling units, 3,211 more than a year ago. The vacancy rate is 2.6 per cent compared to 2.01 per cent in 2014.
There are also 12,998 units being built in Calgary, up 4,125 from last year.
Rent increases have eased as a result of the better supply levels.
Source REP: http://www.repmag.ca/market-update/calgary-rental-vacancies-increase-193788.aspx
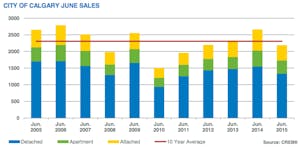
CALGARY REGIONAL HOUSING MARKET STATISTICS – June 2015
Despite the 18 per cent year-over-year decline in June home sales, for a total of 2,183 units, transaction levels remain only five per cent below the 10 year average for June and three per cent above levels over the past five years.
“We’ve seen less concern from consumers lately,” said CREB® president Corinne Lyall. “One of the main reasons is that we haven’t seen the worst case scenarios play out in the energy and housing sectors.”
“Consumers who were waiting for wide-spread price declines have been surprised to see that it just hasn’t happened yet, and so they’ve decided to take advantage of the improved selection and lower lending rates,” said Lyall.
The level of new listings that came on the market in June totaled 3,122 units, resulting in the second month of elevated absorption rates, which placed downward pressure on inventory levels. The overall months of supply continues to remain balanced at 2.3 months.
With conditions remaining relatively stable in June, there was minimal pressure on home prices. The city-wide benchmark price totaled $455,400, a respective monthly and year-over-year gain of 0.29 and 0.13 per cent.
“Even though city-wide prices were essentially unchanged in June, it’s important to note that activity can vary significantly depending on community, property type and price range,” said Lyall. “Every transaction has its own unique features, which is why we always encourage consumers to discuss these differences with local experts.”
Second quarter results pointed towards more stability in the market. The year-over-year decline in sales activity eased from 32 per cent in the first quarter to 22 per cent in the second quarter. Meanwhile, the level of pullback of new listings outweighed the gains recorded in the first quarter, resulting in a year-to-date decline of nearly eight per cent.
While both sales and new listings have slowed for each property type within the city, the apartment sector continues to report the weakest absorption rates.
The weaker rates in this sector are now impacting prices. Despite last month’s improvement in price, the second quarter benchmark price was 0.81 per cent below levels recorded last year and 0.93 per cent below first quarter figures. Year-to-date unadjusted apartment averages continue to remain 1.65 per cent above last year’s levels.
In the detached segment, benchmark prices totaled $515,500 in June, slightly higher than last month and 0.4 per cent higher than June 2014 prices. Meanwhile, the year-to-date benchmark price for detached properties remained 3.44 per cent above last year’s figures.
Against this backdrop, the year-to-date average and median detached home price for Calgary has reported declines of 2.26 and 1.54 per cent city-wide. This doesn’t come as a surprise, given that the share of sales activity has declined in the higher price ranges.
“The housing market is showing some signs of stability right now,” said CREB® chief economist Ann-Marie Lurie. “However, there are several risk factors that could influence the market in the second half of the year,” said Lurie. “Many of these factors will be addressed in CREB®’s mid-year forecast update, which will be released at the end of July.”
Click Here to view the full .pdf Report!
Market moves toward balanced conditions
Calgary housing prices change direction in May
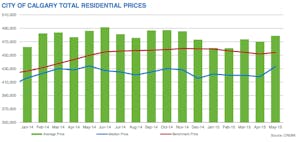
For the first time since December 2014, Calgary’s residential unadjusted benchmark prices improved over the previous month. Within the city of Calgary, housing prices totaled $454,100 in May, a monthly and year-over-year increase of 0.55 and 0.96 per cent.
“For the third month in the row, new listings have eased compared to last year, helping push the market toward more balanced conditions, despite the current environment of slower sales activity,” said CREB® chief economist Ann-Marie Lurie. “This has helped prevent further declines in the unadjusted benchmark price.”
New listings in the city of Calgary totaled 3,161 units in May, a 27 per cent decrease over last year. Meanwhile, total inventory levels for the month were 5,342 units, 16 per cent higher than last year, but eight per cent lower than May levels recorded over the past five years and three per cent lower than average levels over the past 10 years.
Two measures of balance are the months of supply and the sales to new listings ratio. In May, the months of supply decreased to 2.43, while the sales to new listings ratio was 69 per cent, both within the norms for balanced conditions.
“Back in January, higher inventory levels relative to sales activity caused months of supply to rise above five months,” said CREB® president Corinne Lyall. “While some challenges continue to exist for sellers, depending on the property type, price and location, the decline in the months of supply points toward more stability for both buyers and sellers.”
Year-to-date the detached sector recorded the largest decline in new listings at eight per cent. While overall inventory levels are 12 per cent higher than last year’s levels, they remain well below the five and 10 year averages for May.
Detached sales activity in May totaled 1,366 units, with the majority of transactions occurring below $500,000. While conditions are not as tight as last year’s market conditions, which favoured the seller, over the first five months of this year activity in this price range has remained relatively balanced.
“This segment of the detached market continues to have a good amount of consumer activity, as many have taken advantage of the improved selection compared to last year,” said Lyall. “While some have waited for steeper price declines, to this point it just hasn’t happened across all areas of the market. This is partly related to activity in the under $500,000 segment.”
Meanwhile, year-to-date apartment sales and new listings totaled 1,383 and 3,229 units respectively. The May apartment benchmark price of $294,800 increased by 1.20 per cent compared to last month, but remains 0.2 per cent below May 2014 figures.
The apartment sector continues to remain the only sector where prices have contracted relative to last year’s figures.
“While the resale market has recorded an easing of upward inventory pressures, the new home sector has started to record some gains in inventory,” said Lurie. “Current new home inventories remain relatively low. However, the overall impact on Calgary’s housing prices will ultimately depend on the duration of the economic slowdown and the amount of inventory build-up in the new home sector.”
Click Here to see the FULL REPORT
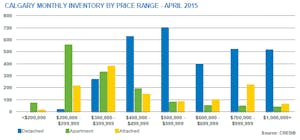
Calgary Regional Housing Market Satistics for April 2015
New Listings Decline as Home Prices Ease
Improved sales to new listings ratio reduces inventory gains
 After the fifth consecutive monthly benchmark price decline in Calgary, the number of new home listings eased to 3,064 units in April, an 18 per cent decrease over the previous year. “With fewer buyers making purchase decisions and improved selection for resale, new home and rental property, sellers have been either adjusting their expectations on price or delaying their plans about when to list their home,” said CREB® president Corinne Lyall.
Sales activity in April totaled 1,957 units, 22 per cent below last year’s levels and nearly 15 per cent below April’s long term averages. Despite weak sales levels, the drop in new listings prevented strong gains in overall inventory levels and helped improve absorption rates in the market.
“While conditions continue to favour the buyer, both the months of supply and the sales to new listings ratio, which represent measures of market balance, tightened in April,” said CREB® chief economist Ann-Marie Lurie. “If this trend continues, it should help prevent resale inventories from rising to previous highs and limit some of the downward price pressures we’ve been seeing.”
Benchmark prices for detached homes totaled $510,200 in April, which represents an unadjusted decline of 0.7 per cent from last month and 1.9 per cent higher than April 2014 figures. Meanwhile, apartment product recorded a monthly decline of 0.7 and a year-over year decline of 0.2 per cent Year-to-date apartment sales activity has declined by 33 per cent, while new listings have risen by nearly eight per cent.
Despite the recent shift in new listings, months of supply in this sector remain elevated, causing steeper monthly price declines and a year-overyear price contraction. “There’s improved selection across all segments of the market, which takes some of the urgency away for buyers as they consider all of their options before making a purchase decision,” said Lyall. “Sellers have more competition and need to be aware of how much product is available in comparable neighborhoods.” The detached sector continues to be the most balanced out of the three market sectors.
For the second month in a row, the sales to new listings ratio and the months of inventory moved to levels that are more consistent with balanced conditions. However, the detached market does vary significantly depending on the price range. “Higher priced properties in the detached sector saw a noticeable decline in absorption levels city-wide, indicating there is less demand relative to supply levels,” said Lurie. “This does not come as a surprise as many of the job losses in recent months have occurred in the higher paying sectors.”
Meanwhile, areas outside city limits are also impacted by the slower economic conditions. Year-to-date sales activity in the surrounding areas totaled 1,346 units, a 26 per cent decline. Despite positive growth following the first quarter, April benchmark prices totaled $434,800, 0.4 per cent below last month’s figures and 5.8 per cent above April 2014 figures. “Market impacts on pricing are wide ranging and ultimately depend on the location, property type, specific features and amount of comparable supply available,” said Lyall. Both buyers and sellers need to be aware of the local market conditions and adjust their expectations accordingly.”
Click on the link below to view a .pdf of your full report!
CALGARY REGIONAL HOUSING MARKET STATISTICS – April 2015
Market Trends: Farm Edition 2013
 Click here on the image above to view the full report: Canada wide!
Central Alberta
Low interest rates and record crops continue to fuel demand for farmland from Kneehill north to Red Deer Counties, with the number of parcels transferring ownership in the 12-month period ( June 2012 to May 2013) on par with last year’s strong performance. Inventory continues to be a challenge in the area, with the shortage placing serious upward pressure on values. Price per acre has increased about 15 per cent on average this year over last, with prime land fetching substantially more. Properties that would have sold at an average of $2,800 to $3,500 an acre one year ago now have a sticker price as high as $3,400 to $4,500 per acre, or as high as $5,500 an acre in Olds. In the Lacombe area near Red Deer, even greater pressure exists, with values rising to as high as $6,500 per acre. Private deals continue unabated between neighbours and landlords/tenants, further hampering listing inventory. By far, the most aggressive players in the market are the supply-managed farms and the Hutterite Colonies—both of whom are looking to expand existing operations. New players have also emerged in recent years, including the investment community, who are now diversifying portfolios to include agricultural land
Many are opting for 3,000 acres to start, with land ideal for cereal grains, including wheat, canola, and barley. Interest rates continue to play a crucial role in the compilation of farmland, with variable rates hovering at two to three percent. Some farmers, anticipating higher rates down the road, are locking in at five- and ten-year terms to secure more long-term favourable rates. The low interest rate environment has discouraged some people from selling their land (unless they can sell at a premium), ultimately limiting the amount of land for sale. Yet, it has also created confidence amongst buyers that can now budget their cash flow to service new debt. Managing risk continues to be a mainstay for those in farming, with many lending institutions now working alongside agricultural communities. One trend that has been supported by loans offered by Farm Credit Canada (FCC) and other financial institutions is the return of younger farmers back into the market. Tremendous crops and record commodity prices in recent years have been a major impetus, in spite of commodities off last year’s peak levels. While market conditions are expected to remain stable for the remainder of the year in Central Alberta, the rapid appreciation experienced in the past is unlikely to continue. Banks are expected to somewhat tighten lending practices in the coming year, which will further serve to slow escalation. Still balance sheets show strong equity across the board, one factor that will support the market for farmland in the months and years ahead.
Southern Alberta
A serious shortage of farmland listings continues to temper momentum in Southern Alberta’s market. Buyers continue to seek out cultivated, dry land and irrigated parcels, but available properties remain few and far between. Approximately 10 farmland listings are currently available for sale. Exclusive listings and private deals continue to be commonplace, keeping listings from the open market and an expanded buyer pool. Any quality sections that have come on stream have moved quickly, and although demand remains strong, lower commodity values have served to create a new level of diligence among buyers. Purchasers are weighing their options and waiting for the ideal parcel. However, when the right opportunity presents, they’re moving quickly. Most farmland properties generally sell within two weeks—some within days. Confidence remains high and most purchasers feel secure in long-term value and potential that farmland investment represents. The bulk of buyers are local end users. The need and desire to expand continues to bolster the market, as everyone from smaller operators, local Hutterite colonies and major players vie to increase their stake. Some U.S. investors have bought up parcels for a long-term hold, with the intent to rent the land to existing operators. Competition for rental land remains solid, with rents averaging $50 to $60 an acre for dry land, while irrigated land with pivot commands a premium. While supply outpaces demand, prices have managed to hold firm over the past year. Grassland is commanding $800 to $1,200, while dry, bare land typically generates $1,000 to $1,600 per acre. Irrigation land requires a premium outlay, usually moving between $5,000 and $8,500 per acre. Farmland closer to key cities/municipalities have garnered top dollar, with notable sales this season running between $9,200 and just under $10,000 an acre. Deals are coming together rather fluidly, as most vendors continue to have realistic expectations. Financing is rarely an issue, despite tighter lending restrictions. Buyers exist for virtually all types of product, from large parcels to quarter sections, gentleman/hobby farms to ranchland and dairy operations, as long as the price reflects fair market value.
To date, the board has recorded roughly three dozen sales, with the busiest season for farmland real estate set to get underway this fall. While the pace remains steady, there are few multiple offers to speak of, as most properties sell right away through word of mouth, either exclusively or in private deals. Or in the case of MLS listings, most realtors have their own willing buyer pool waiting in the wings. Despite news of widespread flooding in Southern Alberta earlier this spring, most crop land was unaffected, although some hail did damage crops in the southeast area of the province. On the whole, yields look good for 2013. Overall, vendors can expect demand to remain in line with current levels for the foreseeable future, while purchasers will benefit from price stability. The potential for rising interest rates is not expected to prove a significant deterrent to eager purchasers, whose belief in land remains steadfast.
Click Here to view the full report for all of Canada.